Douady Hubbard Parameter Rays
Parameter rays are simply the curves that run perpendicular
to the
equipotential curves of the M-set.
Below, we exhibit their identity to the winding number of
the quadratic map.
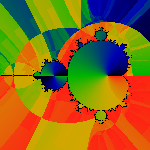
We start this exploration with a picture showing the final
phase angle when an iterated point finally escapes.
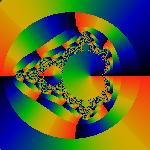 That is, when we've iterated until |zn| > R,
we look at the phase of tn of
zn = rneitn.
In this image, black=0, green=pi, red=2pi. In the outermost part of
this image, we've iterated twice (n=2), and we can see that the phase
circles twice around (i.e. for a total of 4pi). The first visible
band shows the phase winding around four times times, the next eight,
then sixteen. We conclude the phase winds around 2n-1
times when it takes n iterations for a point to escape.
If you look carefully at this picture, several interesting things are
happening. First, the interior of the M-set is colored. Ignore this;
this is an unrelated artifact of the algorithm. Next, notice how
the red-black edges (almost) line up over multiple bands. If we picked
a larger R, they would line up invisibly well. Anyway, they seem to line
up and point at the tips of shoots.
The 'lining up' and doubling for each iteration allows us to use
binary numbers to identify each region. For the outermost region, we
can use 0 to denote the upper half, and 1 to denote the lower half.
Then, for each subsequent band, we can use 0 if the band lines up to
angles less than pi in the previous band, and 1 if it lines up with
angles greater than pi in the previous band.
Thus, any sequence of binary digits can be used to walk us towards
the M-set, with each digit determining which fork should be taken.
If we put a decimal point in front of the sequence, then we have a
binary expansion of a real number between 0 and 1. We refer to this
number, somewhat incorrectly, as the winding number.
Lets look a this another way: for any real number 0 < x < 1
write down its binary expansion. Then use the digits of the binary
expansion to pick one's way down through each band. After an infinite
number of steps, we've reached a unique point at the surface of the
M-set. For every number, there's a point at the surface.
We use the 'lining-up' or period-doubling to subtract out its effects,
and generate the winding number shown here.
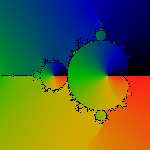 Basically, by looking at the first picture, we can see that we can match
up the colors by totaling up the winding number as the phase wraps
around, and then dividing by 2n-1 for each band. The
algorithm we used here is the simplest and fastest possible. For each
parameter c, and each iteration k, we compute the phase tk
of zk = rkeitk. We use
arctan to compute the phase. Since arctan always uses one branch,
we try to track period doubling by comparing tk to
tk-1. We know that tk should be
increasing usually; and we can use this to count the winding number.
This algorithm is pretty good; its fast, its simple, but is not perfect,
and it has a few small defects.
The defects are barely visible in the image above, but are prominent in
these closeups.
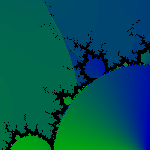
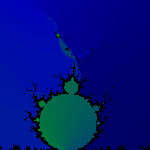 The lozenges and wedges shouldn't be there. The shading should be smooth
and continuous. In these areas, there seems to be no simple way of
discerning a doubling merely by looking at the sequence of
zn's, and basically, we mis-count.
Note, however, that except for these areas where we obviously
mis-count, this simple algorithm does, otherwise, give 'exact' results.
There seems to be no easy way of simply fixing the algorithm, and
not for lack of trying.
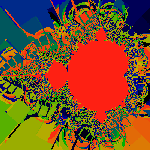 Here, examples of screwed up algorithms.
Beautiful, but meaningless...
Heck, this was supposed to be an art-gallery, until we started
slinging the expository math about. Sigh. So this image is our
contribution to 'Art'. The rest of the images on this page
will have to be considered 'technical diagrams'.
Here's an example of an 'almost' correct algorithm.
The idea here is to try to step/integrate along lines of constant
phase, moving away from the M-set. We use the vector Dm
(employing the notation introduced on the
Potential Page)
as a predictor to step one iteration at a time away from the M-set.
The explicit algorithm is this: Define a sequence {ck}
with c0 = c and k<n, where n is the number of times
that c is iterated until it reaches some (large) escape radius.
Then try
ck+1 = ck - 2Dmk/|Dmk|2
where Dmk is the derivative of the fractional iteration count
m at ck. With each ck, we iterate one less time,
(i.e. we iterate n-k times). Then the phase of cn
seems to be an approximation to the true phase. In particular,
it is free of the discontinuities plaguing the simple algorithm.

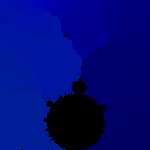 Notice how much prettier, and more visually correct these images
are, compared to their equivalents above.
However, this algorithm has some serious spread-out error terms,
as shown here.
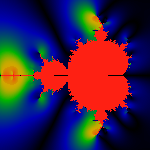 This image shows the difference between the exact phase, and our
approximation. The image is colored so that red represents differences
of 2 percent or more between the approximate and the true phase.
Although 2 percent may seem small, it is hopelessly large when used for
tracing rays.
The lines of constant phase are exactly what is referred to as the
Douady-Hubbard 'external rays'. With a tiny bit of math, its
easy to see that these lines of constant phase are exactly
perpendicular to the equipotential lines.
Using the notation
introduced on the Potential Page,
we have
Dtn = i zn Dzn /
2 |zn|2
and we recall that multiplying by i is the same as rotating by 90
degrees.
Ray Atlas
We use our simple algorithm to draw some rays. The next picture
shows 31 rays, spread out evenly along a circle at infinity,
coming in for a landing.
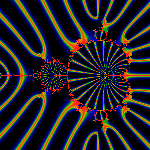 That is, the center of the red part of the rays corresponds to the
the angles 2j pi/31 for j=(0..31). We've colored the image so that
nearby rays are yellow, green and blue in order. We can see how the
colors diverge from each other as they land: this is because rays
must by necessity diverge as they come in to land on different parts
of the M-set. We picked the prime number 31 for a good reason:
rays with simple rational fractions will land where the buds pinch
off from the main cardiod, as the next images show.
Rays, 105 spread out evenly at the circle at infinity.
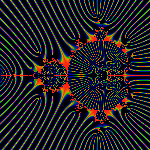 That is, the center of the red lines lies at 2j pi/105 for j=(0..105).
Note how a number of these rays land where buds pinch off from the main
cardiod.
We can easily count these by hand. The j=0 ray lies due east, emanating
from the scorpion tail. Then we count.
The rays at j=7,14 pinch off the n=4 bud (and thus, we say that the
'arc-angle size' of the n=4 bud is (14-7)/105 = 7/105=1/21).
The two rays j=15,30
pinch off the n=3 bud (for an angular size of 15/105=1/7).
The two rays j=35,70 pinch off the n=2 bud (for an angular size of
35/105=1/3). With a bit of combinatorial effort, some fairly general
expressions for the angular sizes of buds, antennae, and other features
on the M-set can be given as exact rational numbers. This is one of the
main results of the Douady-Hubbard theory.
To see that the exact ratios are really exact, compare the pictures
above and below.
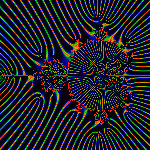 Here, again we have 105 rays, but slightly askew, so that no simple
fractions arise. The angles center of the red days are given by
4j pi/211 for j=(0..105). By the way, notice the Moire patterns in the
interior of the M-set. The interior has nothing to do with anything,
its just a by-product of the algorithm we use to generate these
pictures.
Here are some rays in the vicinity of the n=3 bud.
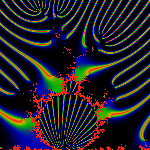
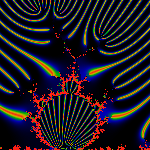 The one on the left has red = 2j pi/256 for j=(0..256); the one on the
right has red = 4j pi/513 for j=(0..256).
There are two interesting things about this picture: fractions that have
a power-of-two in the denominator seem to be associated with rays that
land at the tips of antenna. (We already noticed this above, in the very
very first picture). The second interesting thing is that
most of the landing rays land on the antenna, not on the bud.
From this, we conclude that most of the arc-angle size of the bud
is in fact the antenna.
Here's the n=3 bud when there are 1008=16*9*7 rays distributed around the circle.
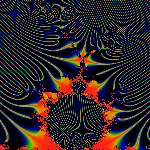 As we saw above, the n=3 bud is pinched off by rays [1/7,2/7].
The largest bulblet on top of it is at [10/63,17/63]. This
rapidly turns into a game of common multiples: note that
10/63 = 1/7 + 1/63 = 1/7(1+1/9). And symmetrically on the other
side: 17/63 = 2/7 - 1/63. The width of the bulblet is, of course, 1/9.
There are three rays that land at the trifurcation of the antenna,
they are [81/504, 99/504, 135/504]. We can't help but notice
that 81/504 = 10/63+1/504 = 10/63(1+1/8).
Notice also, the left hand side of the antenna (the larger side)
as a width of 1/14, while the right hand side has a width of 1/28.
And finally, the smallest trifurcation visible in this image is
at [207/1008, 225/1008, 261/1008]. The widths are 1/56 on the right,
and 1/28 on the left.
If we were to blow things up to 2016 rays, we'd see a trifurcation
coming in on the right hand side of the antenna.
Its curious how the size of a smaller wake inside a larger one is
always the largest possible, with the simplest 'suitable' fraction.
Rays in the vicinity of the n=2 bud.
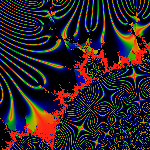 Red = 2j pi/1155 for j=(0..1155). Note that 1155=3*5*7*11.
Again, the vast majority of rays are soaked up on antenna. Note
that the algorithm defects are quite visible in this closeup.
The Moire pattern is also rather pretty.
A Detailed Atlas
The results above are summarized and extended on the
Visual Atlas and Angle Tables pages.
The Visual Atlas provides a visual map of many arc angles,
while the Angle Tables provide tabular listings and formulas
for may of the features.
Be sure to also check the bibliography on the
Potential Page for more details.
Copyright (c) 2000 Linas Vepstas. All Rights Reserved.
Linas Vepstas December 2000
linas@linas.org
Return to Linas' Art Gallery
 That is, when we've iterated until |zn| > R,
we look at the phase of tn of
zn = rneitn.
In this image, black=0, green=pi, red=2pi. In the outermost part of
this image, we've iterated twice (n=2), and we can see that the phase
circles twice around (i.e. for a total of 4pi). The first visible
band shows the phase winding around four times times, the next eight,
then sixteen. We conclude the phase winds around 2n-1
times when it takes n iterations for a point to escape.


 That is, the center of the red part of the rays corresponds to the
the angles 2j pi/31 for j=(0..31). We've colored the image so that
nearby rays are yellow, green and blue in order. We can see how the
colors diverge from each other as they land: this is because rays
must by necessity diverge as they come in to land on different parts
of the M-set. We picked the prime number 31 for a good reason:
rays with simple rational fractions will land where the buds pinch
off from the main cardiod, as the next images show.


